
IDA Vitality Index
A Strong Downtown is Critical for a Successful City and Region
Despite a relatively small share of a city’s overall geography, downtowns deliver significant economic and community impacts across both city and region. Beyond being great places, what key characteristics make a downtown vital, strong and active? Downtowns and commercial districts should have dynamic economies that create opportunity; make it available to everyone; and draw people for work, play, and living.
The IDA Vitality Index, powered by Stantec, functions as an interactive, online tool for benchmarking the vitality of downtowns across the United States. The Vitality Index builds on IDA’s pioneering research in The Value of U.S. Downtowns and City Centers, and measures vitality through three principles that study identified: Economy, Inclusion and Vibrancy.
Through these three principles, each comprising five core indicators, the Vitality Index aims to capture the pulse of the downtown and enable urban place managers to quantify and benchmark a district’s performance against peer cities. The Index uses a benchmarking system to understand how each of the three principles contributes to an overall combined score calculated by comparing each metric to the national average. Most valuable, it establishes a baseline and provides a data-driven method for a community to measure its improvement over time.
The Vitality Index includes data from 44 downtowns across the U.S., all of which have dynamic urban place management organizations that participated in IDA’s Value of U.S. Downtowns and City Centers study. Future editions of the Vitality Index will expand to additional districts across the U.S.
IDA members can access detailed metric information and comparison on a member-only Vitality Index. This version of the Index allows members to select specific districts for comparison, view additional information by hovering over the district, and compare districts to their tier performance. These additional data points enable districts to better understand opportunities for strategic growth.
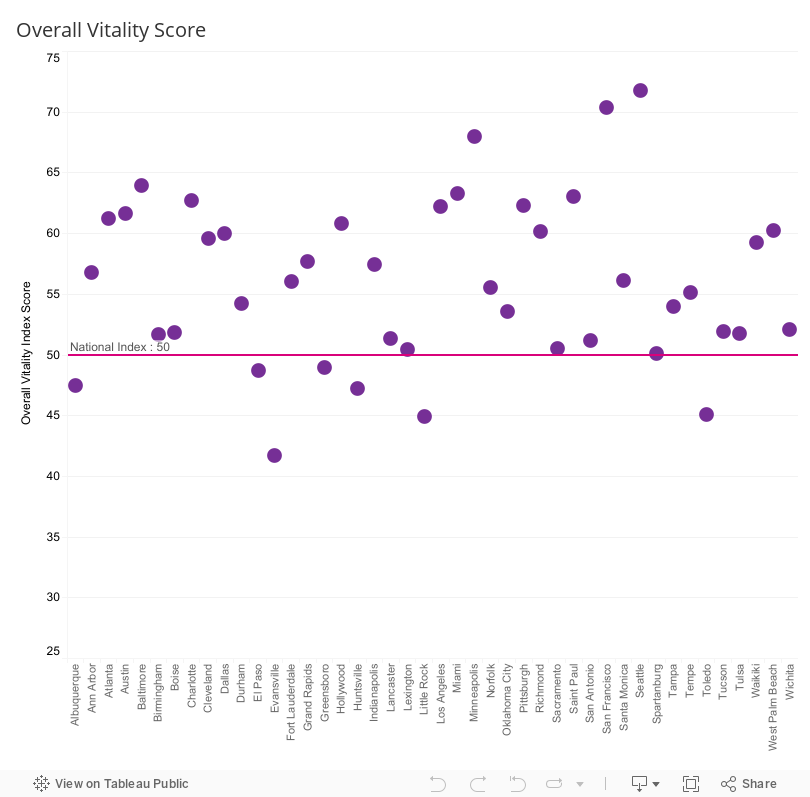
How Vital Are These Districts?
This chart shows the overall vitality score of each study district (the average of the Economy, Inclusion, and Vibrancy scores) compared to the national score of 50.
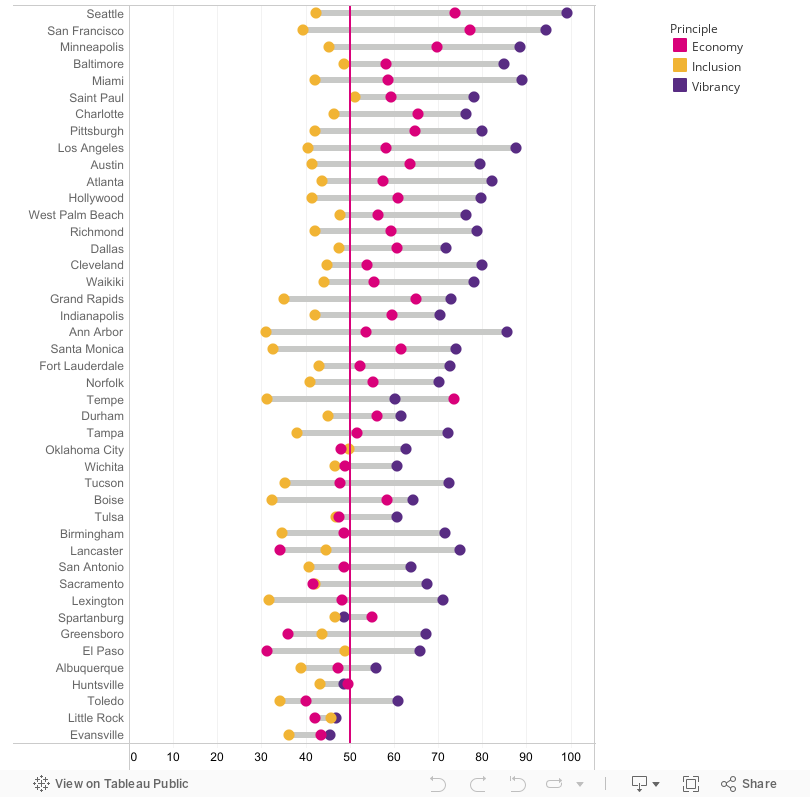
How Vital are These Districts in Economy, Inclusion and Vibrancy?
The below chart shows how the study districts perform on each of the three principles: Economy, Inclusion and Vibrancy. It provides additional insight and comparison metrics against the nation and other districts, and demonstrates where improvements can be made.
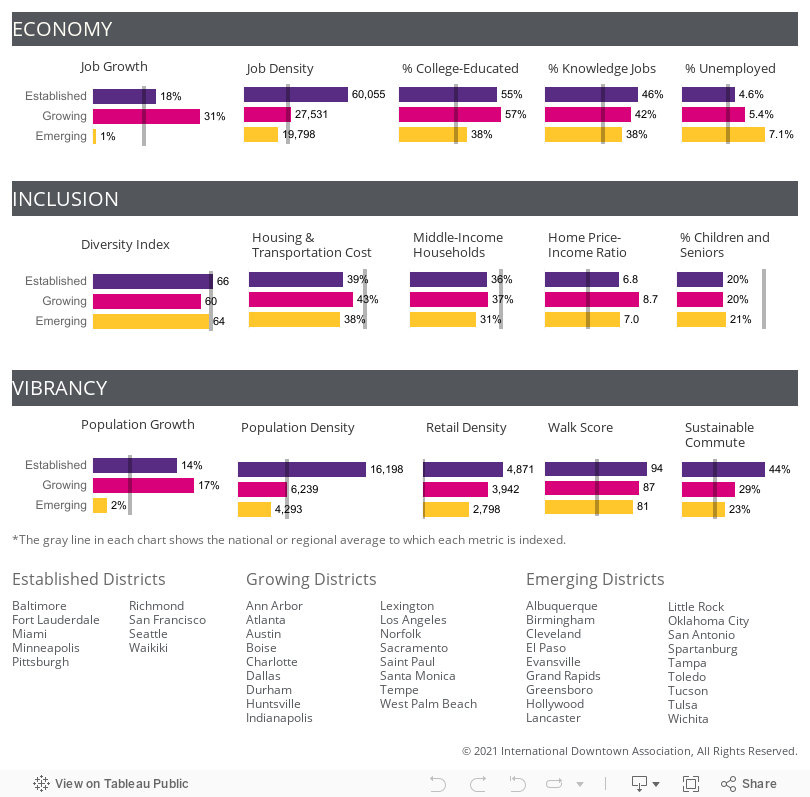
What Metrics are Used for Scoring and how do District Tiers Perform?
This chart is a more detailed analysis of how downtowns in different tiers (established, growing, emerging) perform on the metrics that make up each principle.
Established downtowns are home to a large percentage of citywide residents, jobs, and assessed value. Growing downtowns are those with the fastest-growing populations and job counts. Finally, emerging downtowns show rapid growth in either residents or jobs (though not both), or have begun to show positive signs of growth.
Key Findings
Nearly all downtowns outperformed the national average in vitality.
- 33 out of the 44 downtowns in the study score at or above 50, the national benchmark. (A score above 50 means that a downtown’s vitality metrics outperform those of the nation as a whole.) The remaining downtowns come within eight points of the national benchmark, which identifies them as performing solidly though slightly below the national average. These results against the national benchmark clearly show downtowns as concentrated centers of vitality.
The most vital downtowns have dynamic economies that strongly outperformed the national average.
- The downtowns scoring highest on Economy all have extremely high job densities.
All downtowns can improve on inclusion, but downtowns tracked close to metro averages in being inclusive homes for all residents.
- Inclusion scores lagged in most districts, not because of a lack of racial diversity, but because of higher costs of living. Compared to residents citywide, downtown residents spend a lower proportion of their incomes on housing costs and transportation. People who want to own their home in downtown, however, face a potentially serious obstacle: the typical downtown offers few affordable ownership options for median-income households.
Vitality does not correlate reliably with downtown size.
- All downtowns can be vital. Although large cities like San Francisco do contain downtowns synonymous with Vibrancy, district size in this study showed no correlation with downtown vitality. The downtowns with the five highest vitality averages varied in size from 1.2 square miles to 5.05 square miles.
For more information on methodology, read the Vitality Index documentation. Send feedback and questions to IDA’s Research Department.